
Pomora
Product design + frontend
An intelligent Pomodoro timer designed to calm the chaos.
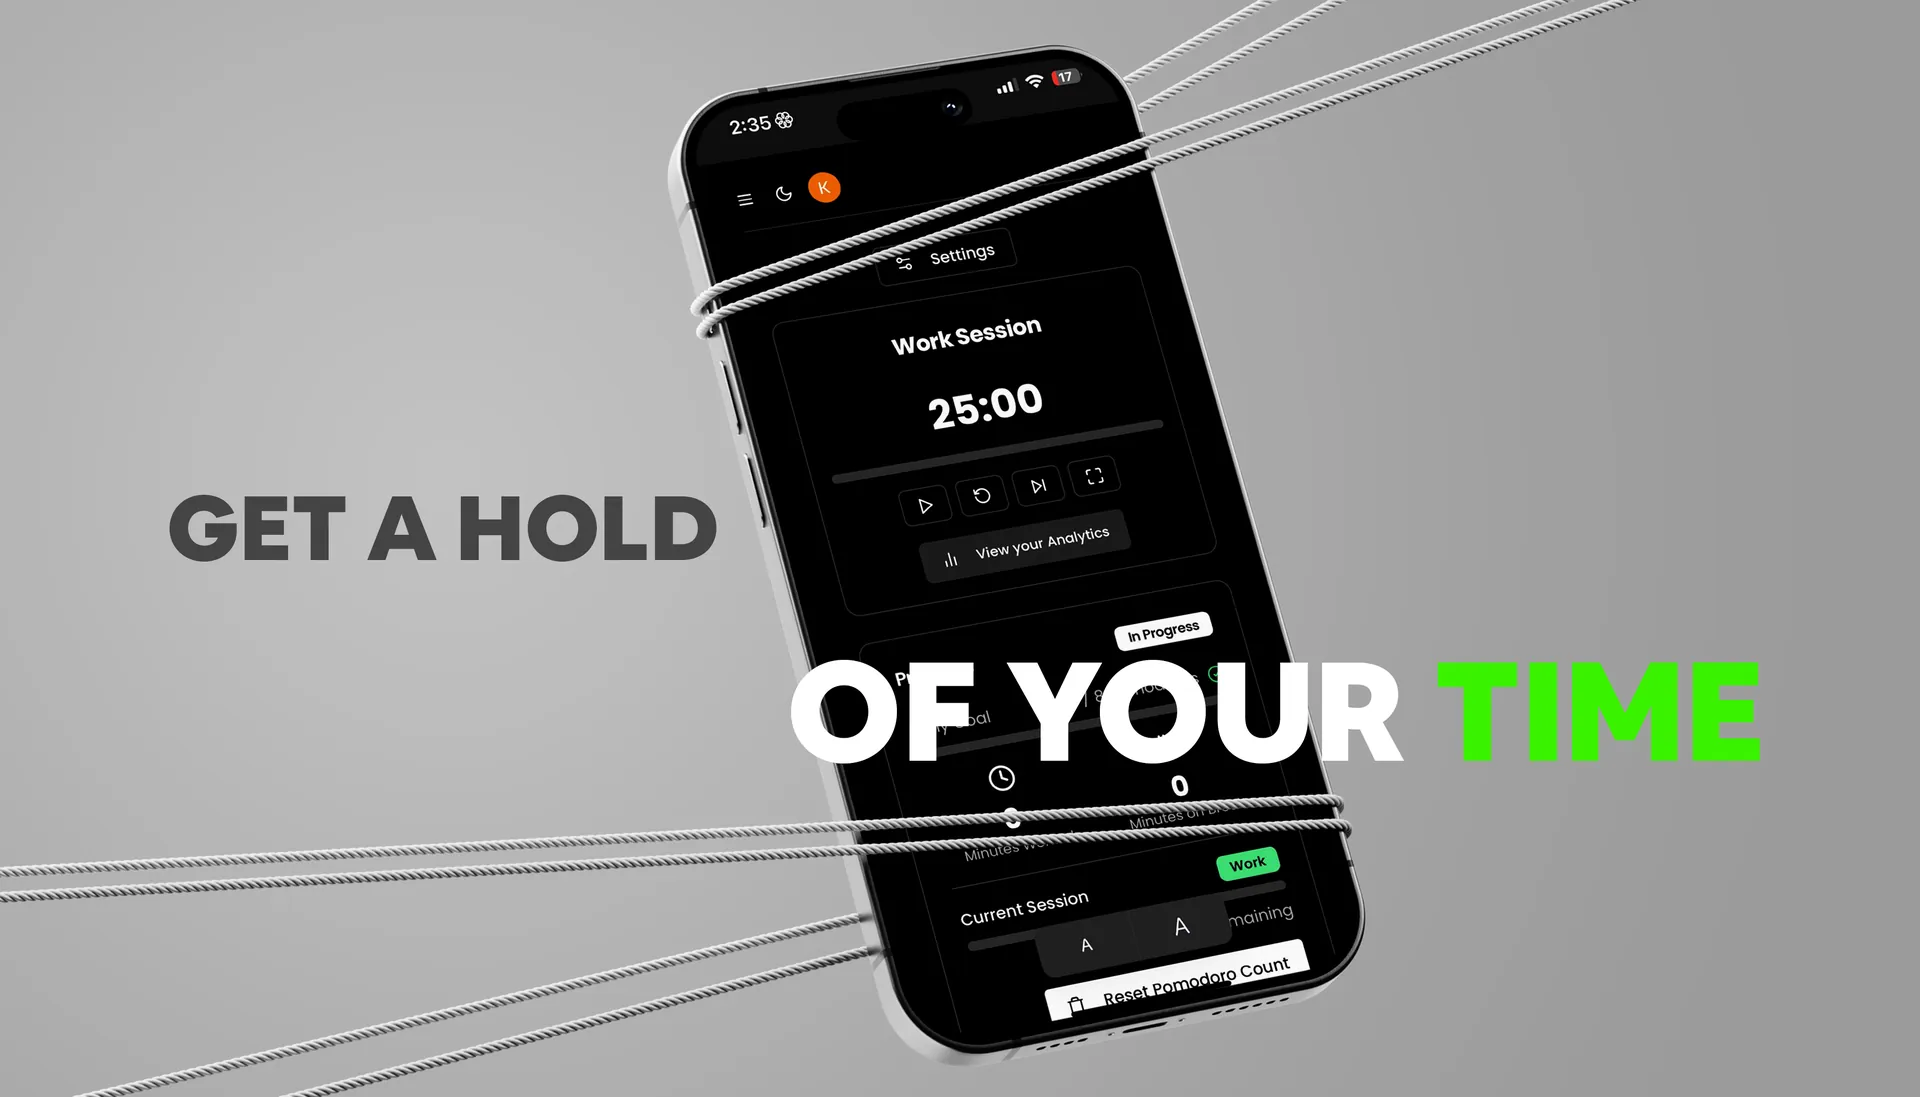
Pomora started during an all-nighter: too much coffee, a looming deadline, and the thought that there had to be a better way to work in focused stretches.
It became a Pomodoro timer with a task list, analytics, and a bit of gamification to make coming back feel good.
Where it started
“There’s got to be a better way!”
I’ve always been a bit of a productivity nerd. Pomora began as a tool for myself: a timer that actually gets how I work.
Building it was messier than planned. Making a timer behave across time zones turned out to be properly hard, and every bug I squashed felt like a small personal victory.
The idea
Distractions make it hard to keep momentum.
Pomora pairs structured focus and break cycles with subtle cues and analytics, so staying focused feels natural, not forced.
Core features
A timer, a to-do list, and an honest look at your week.
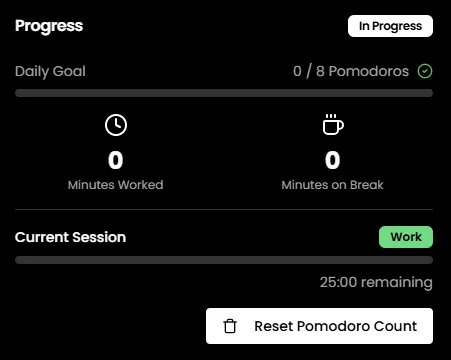
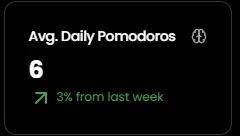
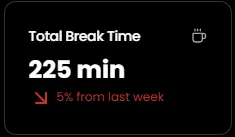
- 01
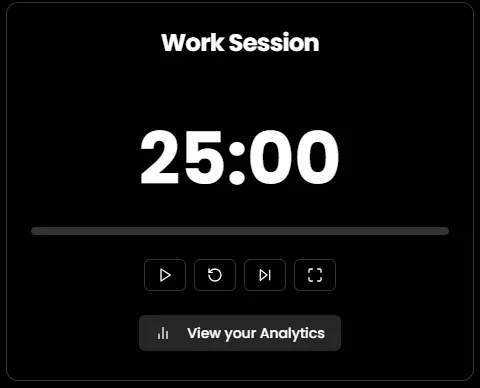
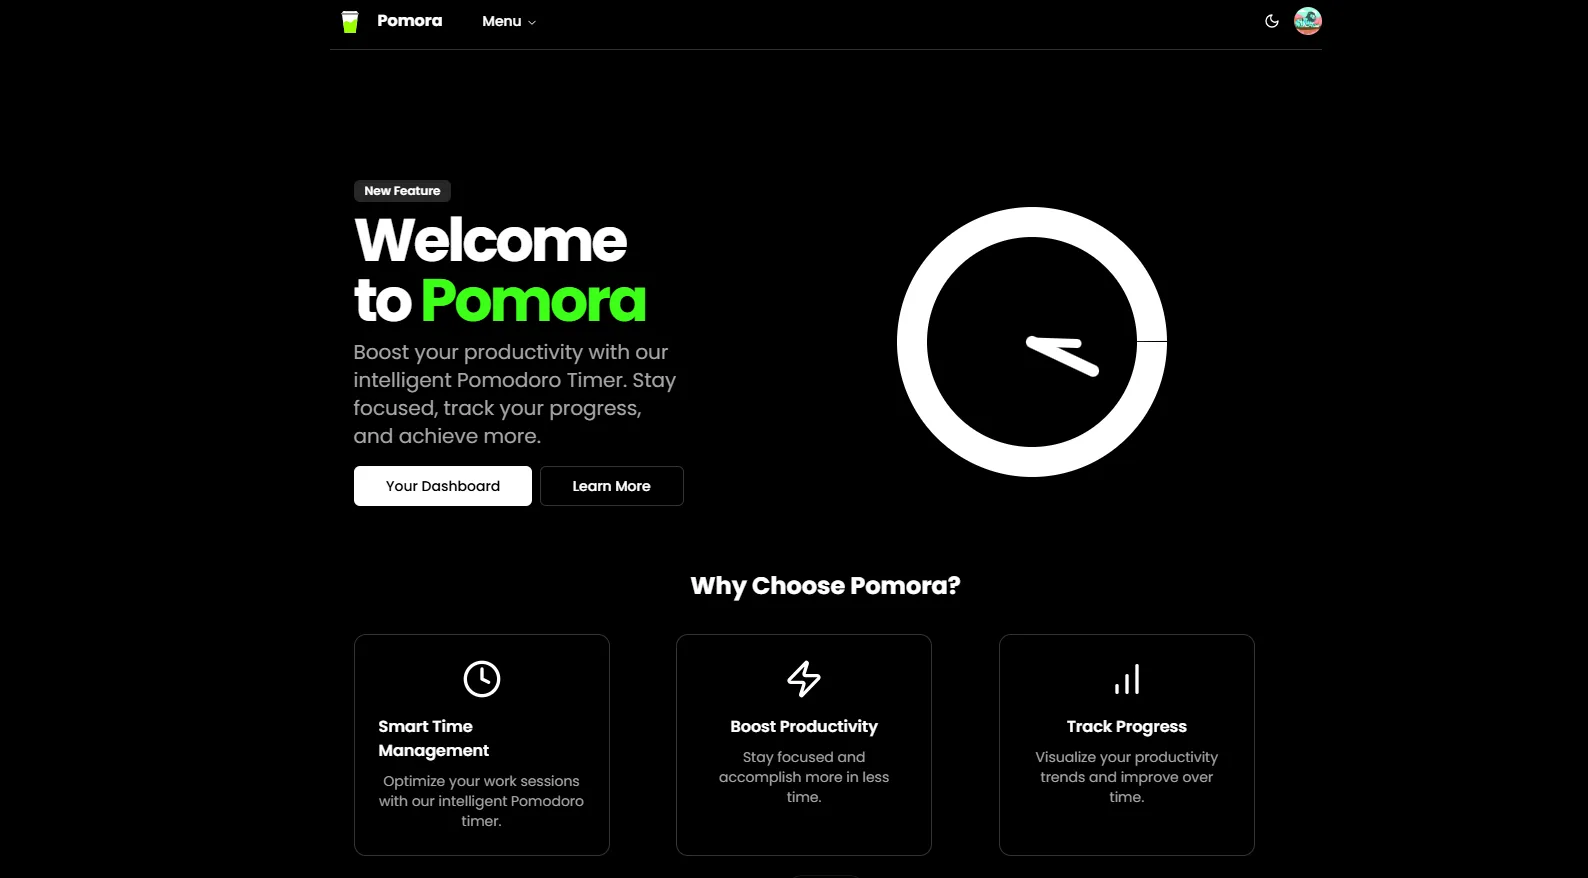
Intuitive timer. A circular progress ring, with color cues for focus and break.
- 02
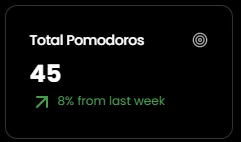
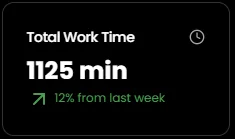
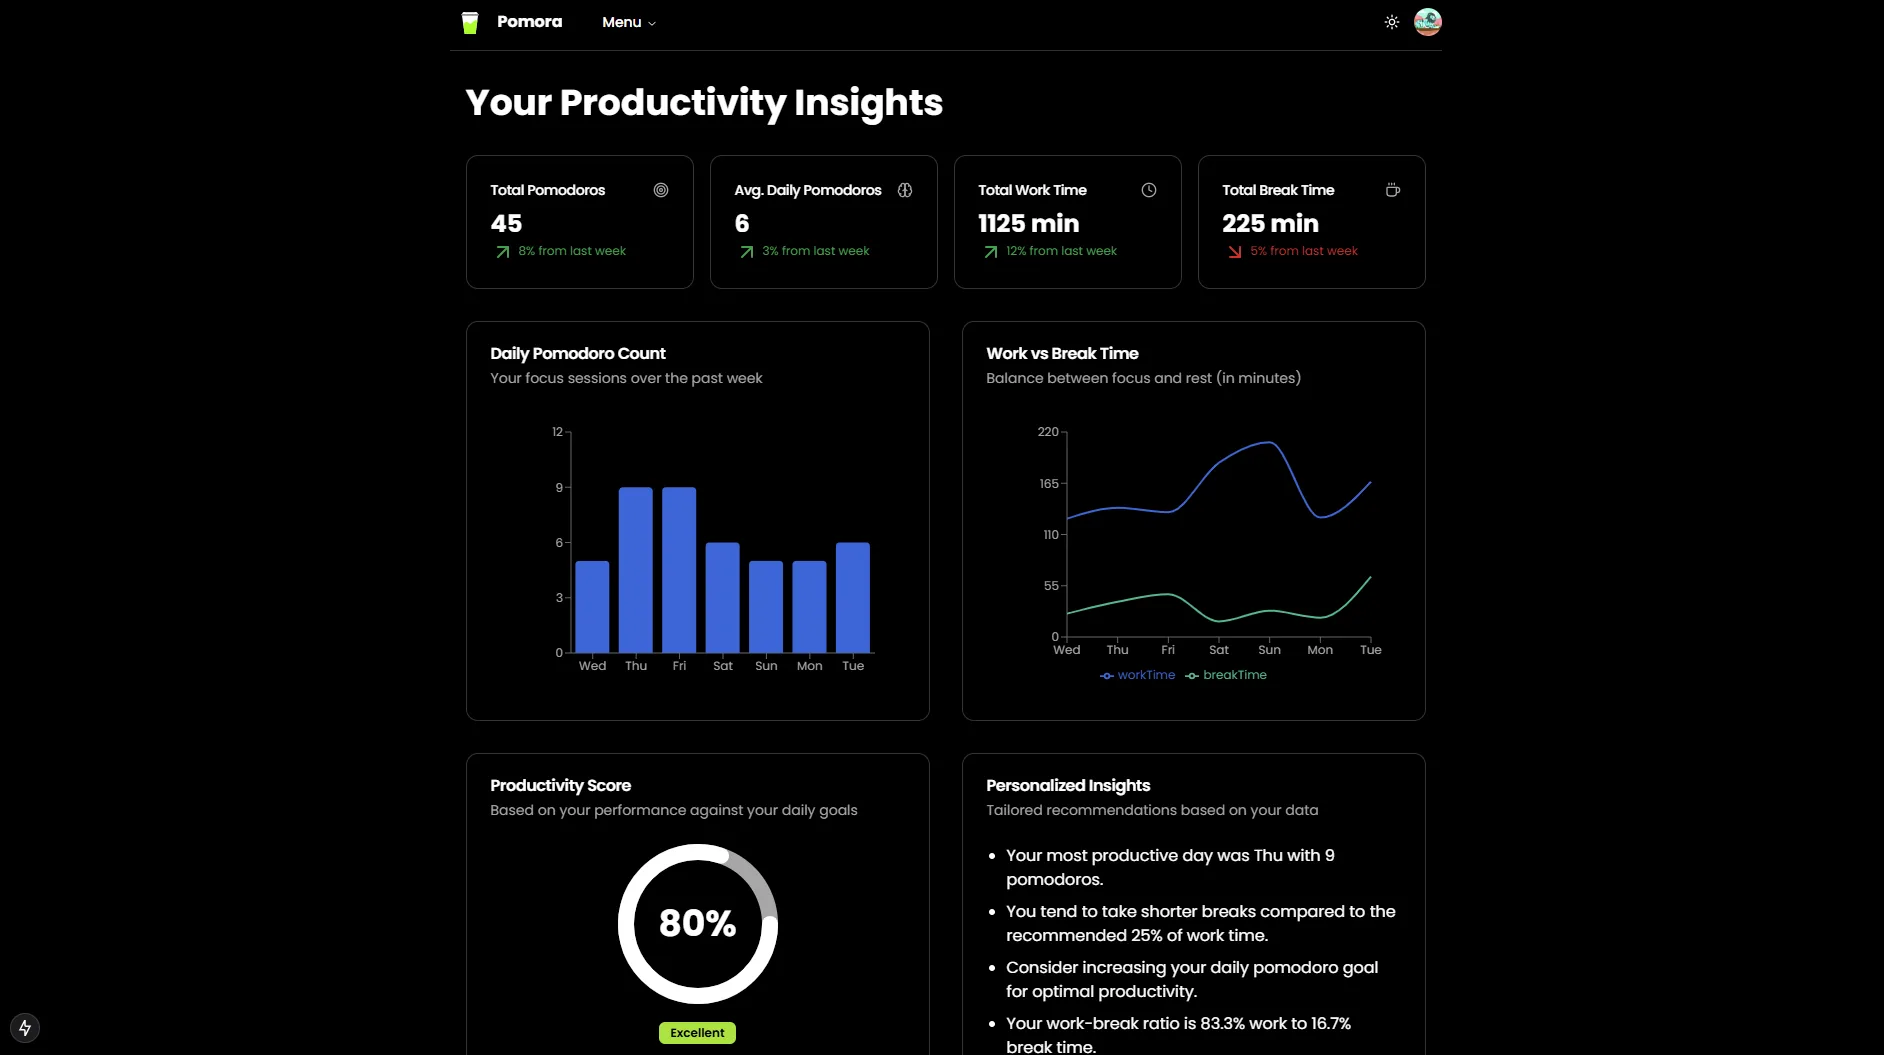
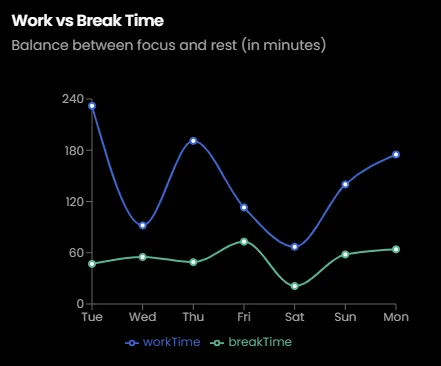
Analytics. Your focus and break time, tracked week over week.
- 03
Tasks. A to-do list built in, so planning and doing live together.
- 04
Sync. Pick up on any device where you left off.
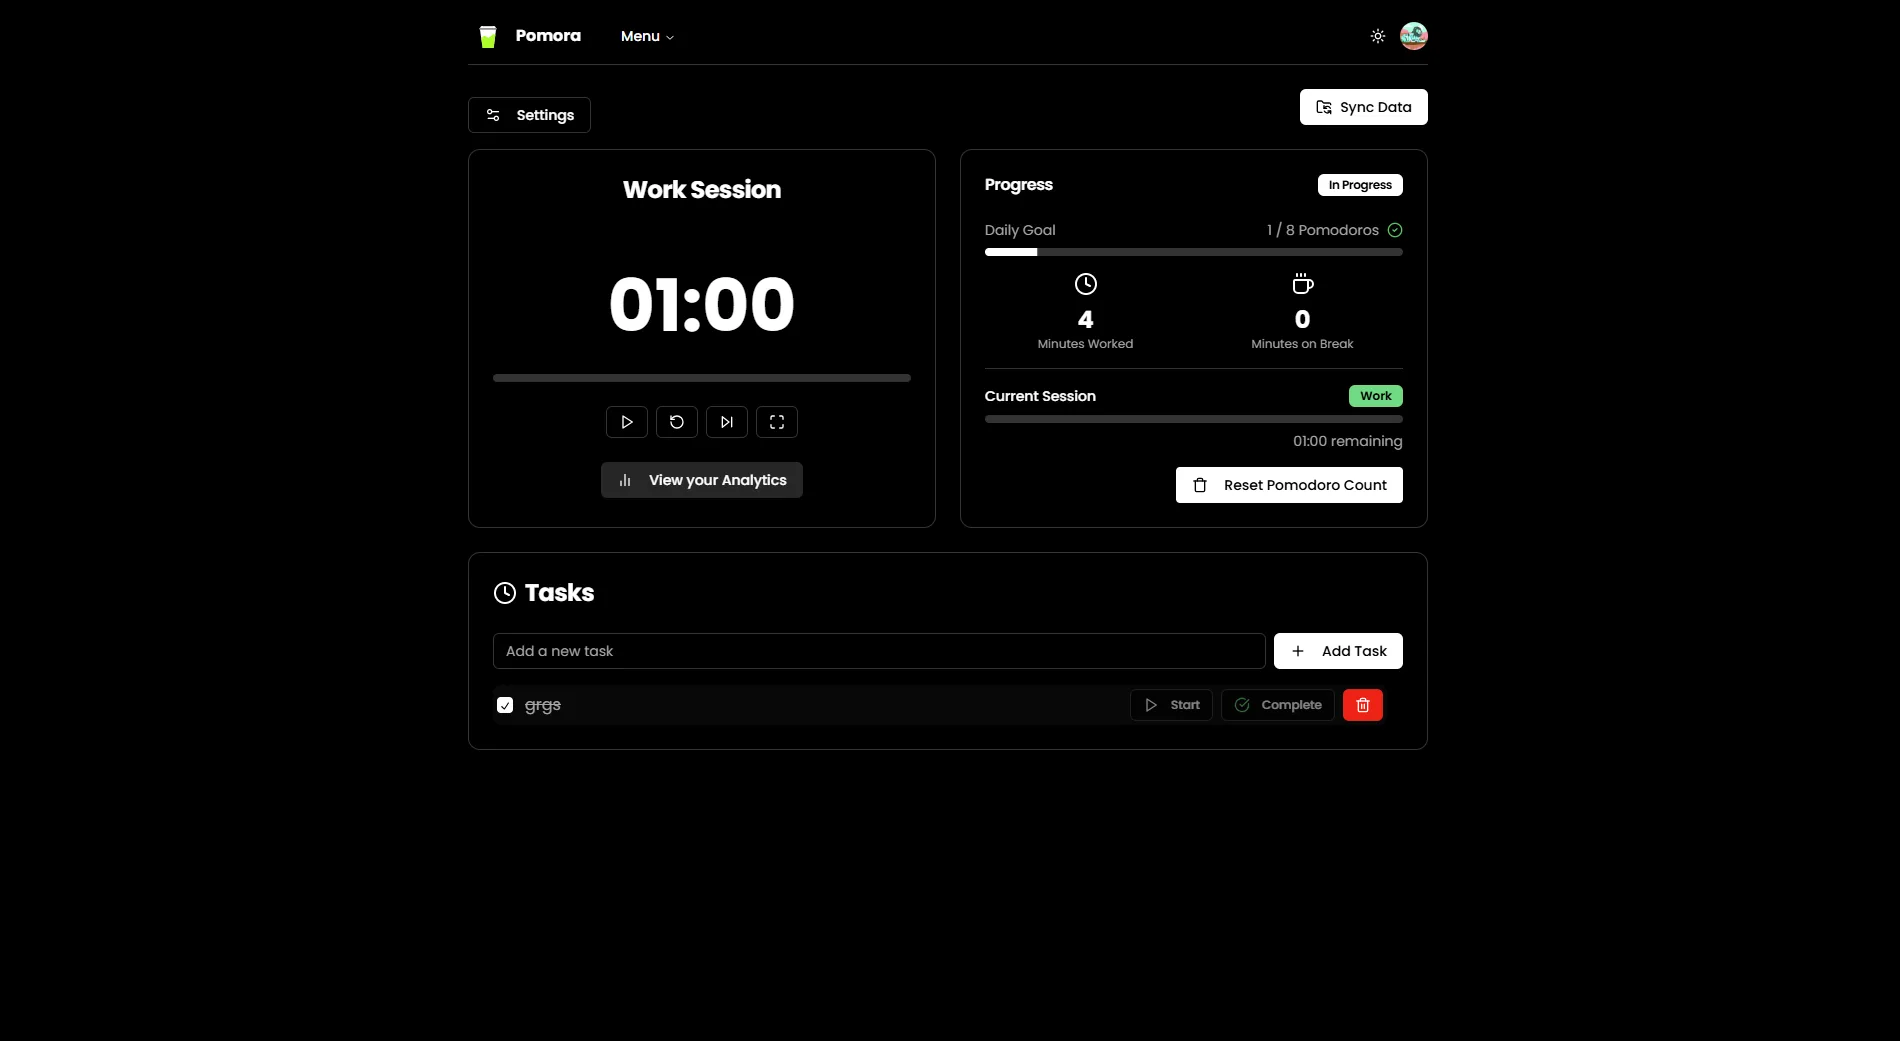
Inside the app
Design approach
Calm on purpose.
- 01
Distraction-free layout. Minimal chrome, so the timer is the only thing asking for attention.
- 02
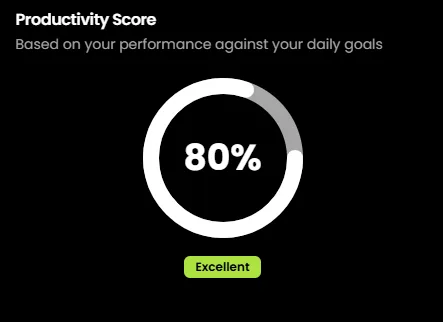
Color that means something. Focus and break each have their own color, readable at a glance from across the room.
- 03
Motion as feedback. Subtle animation only where it tells you something changed.
- 04
Mobile first. Designed for a phone propped next to your laptop.
Process
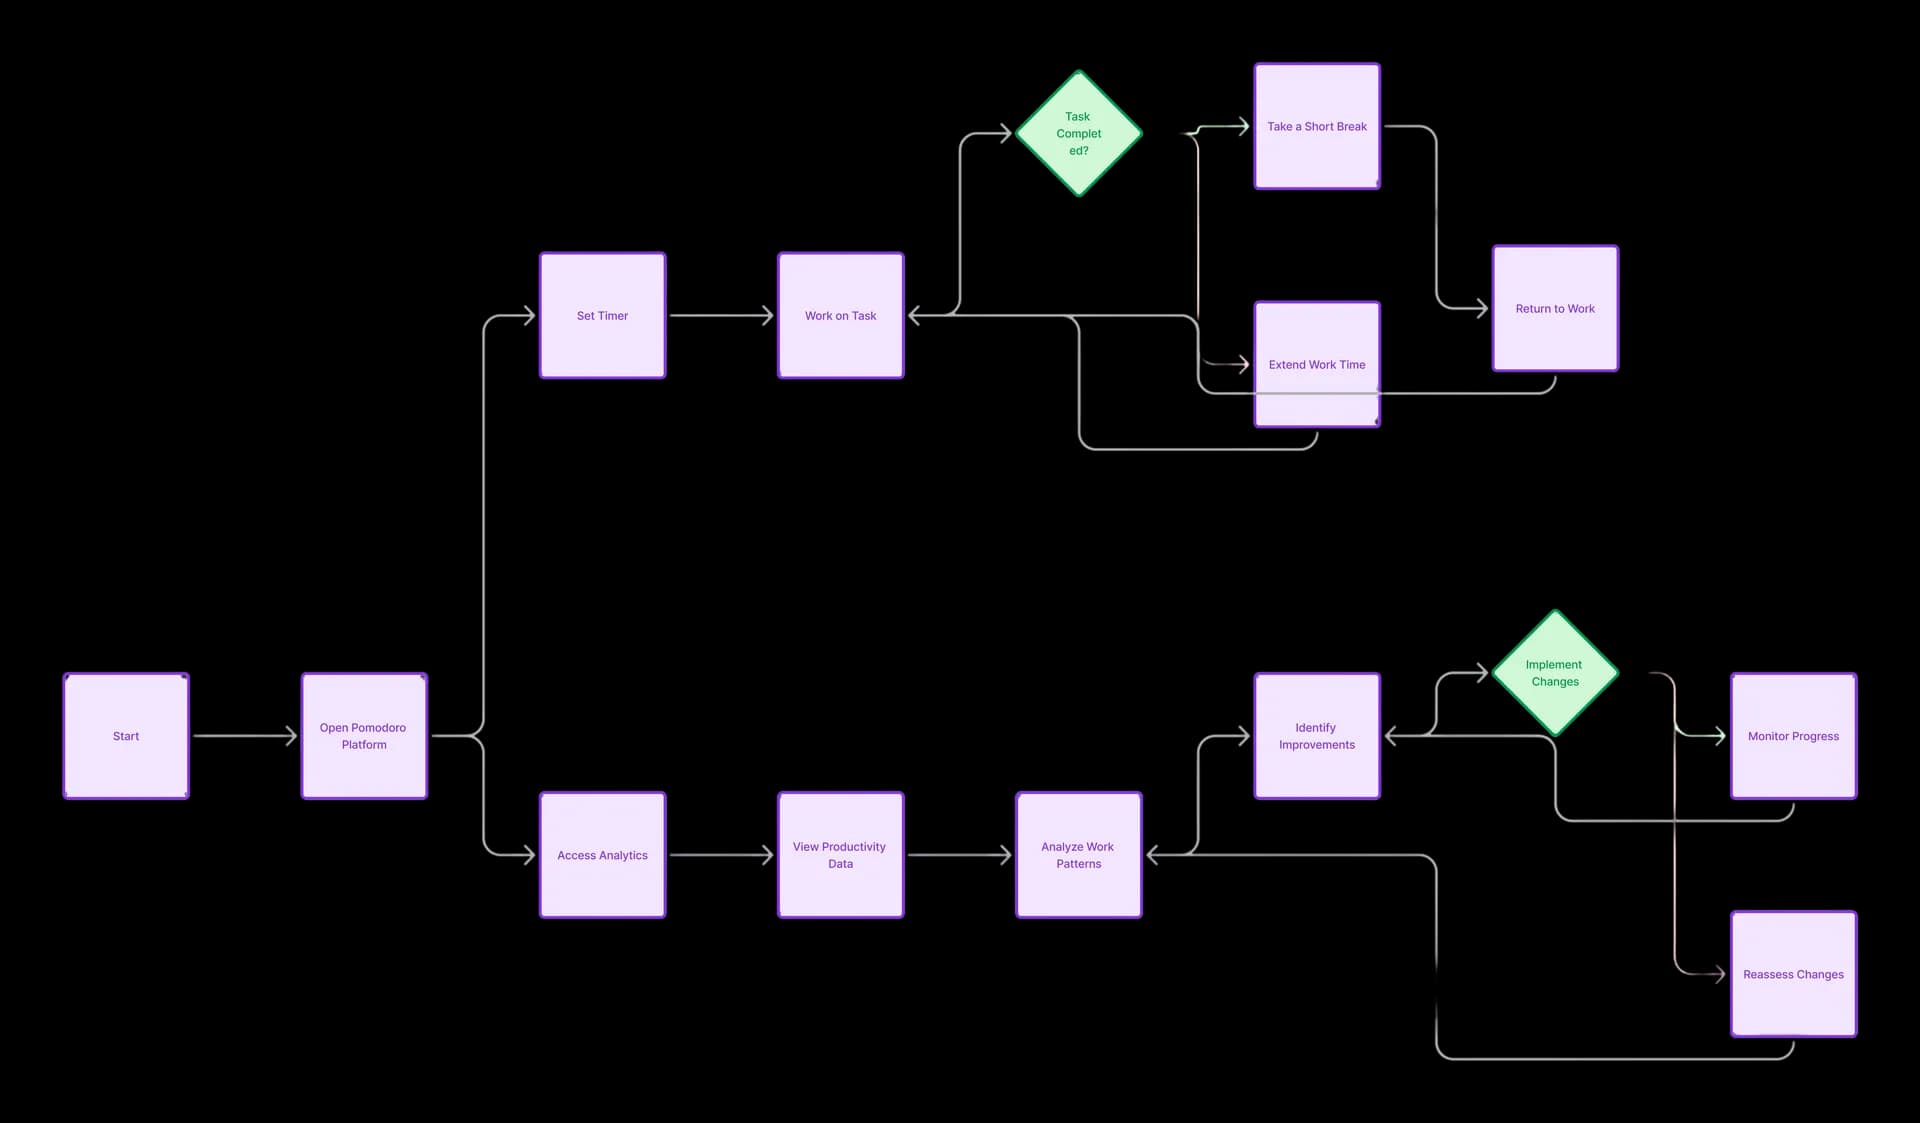
From a late-night idea to a working MVP.
- 01
Research and scope Looked hard at competing productivity tools, defined the core focus-cycle requirements, and separated the essentials from nice-to-haves.
- 02
Design system Low-fidelity user-flow wireframes, an accessible palette, and a geometric type hierarchy set in Poppins.
- 03
Build Next.js and Tailwind with shadcn/ui components, Clerk for auth, and smooth 60fps timer interactions.
- 04
Test and ship Unit, integration, end-to-end, and performance testing, then automated deploys to Vercel.
Then people used it
I made it for me. Then the messages started.
The best part came when other people started using Pomora and writing to me about how it changed their work habits. Suddenly I had feature requests and bug reports (mostly polite, thankfully).
What’s next
Enhanced analytics and social accountability modes are next. Further out: a timer that notices you need a break before you do.
And yes, a coffee maker that brews a fresh cup right as a session ends. I called dibs.